Dasar
Perf adalah alat profil yang berguna yang mungkin berguna untuk melacak panggilan/fungsi kernel/aplikasi dan banyak lagi. Misalnya untuk memulai kinerja sebagai alat monitor langsung yang mirip dengan eksekusi teratas:
# perf top
Ini akan menampilkan penghitung kinerja secara real time. Contoh keluaran:
PerfTop: 474 irqs/sec kernel:100.0% exact: 0.0% [4000Hz cpu-clock], (all, 6 CPUs)
---------------------------------------------------------------------------------------------------------------------------------------------------------------------------------------------------------------

22.45% perf.3.8.13-98.7.1.el7uek.x86_64 [.] dso__load_kallsyms
16.33% perf.3.8.13-98.7.1.el7uek.x86_64 [.] symbol_filter
12.24% [kernel] [k] kallsyms_expand_symbol
10.20% [kernel] [k] module_get_kallsym
10.20% [kernel] [k] vsnprintf
Baris pertama adalah persentase waktu yang dihabiskan, kedua adalah fungsi dan ketiga adalah DSO (Objek bersama dinamis).
Contoh penggunaan kinerja – 1
Saat menjalankan dd kecepatan operasi tulis tampaknya terhenti di sekitar 50MB/dtk – tanda langsung tidak digunakan:
# dd if=/dev/zero of=/u01/test1 bs=1M count=500
500+0 records in
500+0 records out
524288000 bytes (524 MB) copied, 9.44658 s, 55.5 MB/s
Saat beralih ke sistem file lain, tampaknya jauh lebih cepat:
# dd if=/dev/zero of=/u02/test1 bs=1M count=500
500+0 records in
500+0 records out
524288000 bytes (524 MB) copied, 0.166796 s, 3.1 GB/s
Mari kita mulai perintah dd dengan perf:
# perf record dd if=/dev/zero of=/u01/test1 bs=1M count=500
500+0 records in
500+0 records out
524288000 bytes (524 MB) copied, 10.7182 s, 48.9 MB/s
[ perf record: Woken up 2 times to write data ]
[ perf record: Captured and wrote 0.364 MB perf.data (~15920 samples) ]
Mari kita tinjau datanya:
# perf report

# ========
# captured on: Sat Aug 20 07:09:38 2016
# hostname : localhost.localdomain
# os release : 3.8.13-98.7.1.el7uek.x86_64
# perf version : 3.8.13-98.7.1.el7uek.x86_64
# arch : x86_64
# nrcpus online : 6
# nrcpus avail : 6
# cpudesc : Intel(R) Core(TM) i7-4790K CPU @ 4.00GHz
# cpuid : GenuineIntel,6,60,3
# total memory : 3785340 kB
# cmdline : /usr/libexec/perf.3.8.13-98.7.1.el7uek.x86_64 record dd if=/dev/zero of=/u01/test1 bs=1M count=500
# event : name = cpu-clock, type = 1, config = 0x0, config1 = 0x0, config2 = 0x0, excl_usr = 0, excl_kern = 0, excl_host = 0, excl_guest = 1, precise_ip = 0, id = { 25, 26, 27, 28, 29, 30 }
# HEADER_CPU_TOPOLOGY info available, use -I to display
# HEADER_NUMA_TOPOLOGY info available, use -I to display
# pmu mappings: software = 1, tracepoint = 2, breakpoint = 5
# ========
#
# Samples: 9K of event 'cpu-clock'
# Event count (approx.): 9256
#
# Overhead Command Shared Object Symbol
# ........ ....... ................. ...........................................
#
46.72% dd [kernel.kallsyms] [k] native_read_tsc
43.90% dd [kernel.kallsyms] [k] loop_make_request
1.77% dd [kernel.kallsyms] [k] finish_task_switch
Dari output kita dapat melihat bahwa dd menyebabkan sumber daya sistem terdengar (native_read_tsc dan loop_make_request). /u01 adalah perangkat loop yang digunakan nanti sebagai volume lvm2.
Debug lebih lanjut dengan perf saat menggunakan opsi panggilan grafik:
# perf record -g fp dd if=/dev/zero of=/u01/test1 bs=1M count=500
500+0 records in
500+0 records out
524288000 bytes (524 MB) copied, 10.9209 s, 48.0 MB/s
[ perf record: Woken up 9 times to write data ]
[ perf record: Captured and wrote 2.270 MB perf.data (~99186 samples) ]
Mari kita tinjau datanya:
# perf report
# ........ ....... ................. ...........................................
#
53.13% dd [kernel.kallsyms] [k] native_read_tsc
|
--- native_read_tsc
|
|--99.08%-- read_tsc
| ktime_get_ts
| |
| |--89.51%-- __delayacct_blkio_start
| | io_schedule
| | |
| | |--99.68%-- sleep_on_buffer
| | | __wait_on_bit
| | | out_of_line_wait_on_bit
| | | __wait_on_buffer
| | | |
| | | |--98.42%-- __sync_dirty_buffer
| | | | sync_dirty_buffer
| | | | |
| | | | |--98.51%-- ext2_new_blocks
| | | | | ext2_get_blocks
| | | | | ext2_get_block
| | | | | __block_write_begin
| | | | | block_write_begin
| | | | | ext2_write_begin
| | | | | generic_file_buffered_write_iter
| | | | | __generic_file_write_iter
| | | | | generic_file_write_iter
| | | | | do_aio_write
| | | | | do_sync_write
| | | | | vfs_write
| | | | | sys_write
| | | | | system_call_fastpath
| | | | | __GI___libc_write
| | | | |
| | | | |--1.33%-- __ext2_write_inode
| | | | | ext2_write_inode
| | | | | __writeback_single_inode
| | | | | writeback_single_inode
| | | | | sync_inode
| | | | | sync_inode_metadata
| | | | | generic_file_fsync
| | | | | ext2_fsync
| | | | | generic_write_sync
| | | | | generic_file_write_iter
| | | | | do_aio_write
| | | | | do_sync_write
| | | | | vfs_write
| | | | | sys_write
| | | | | system_call_fastpath
| | | | | __GI___libc_write
| | | | --0.16%-- [...]
| | | |
| | | --1.58%-- sync_mapping_buffers
| | | generic_file_fsync
| | | ext2_fsync
| | | generic_write_sync
| | | generic_file_write_iter
| | | do_aio_write
| | | do_sync_write
| | | vfs_write
| | | sys_write
| | | system_call_fastpath
| | | __GI___libc_write
| | --0.32%-- [...]
| |
| --10.49%-- delayacct_end
| __delayacct_blkio_end
| io_schedule
| |
| |--90.00%-- sleep_on_buffer
| | __wait_on_bit
| | out_of_line_wait_on_bit
| | __wait_on_buffer
Dari output ini kita dapat melihat lebih banyak informasi tentang aktivitas perintah dd. Pertama-tama kita melihat bahwa menjalankan perintah dd menunjukkan bahwa kita sedang melakukan penulisan sinkron yang memaksa kita untuk menggunakan sync_write.
Contoh kedua adalah dari /u02:
# perf record -g fp dd if=/dev/zero of=/u02/test1 bs=1M count=500
500+0 records in
500+0 records out
524288000 bytes (524 MB) copied, 0.178937 s, 2.9 GB/s
[ perf record: Woken up 1 times to write data ]
[ perf record: Captured and wrote 0.093 MB perf.data (~4083 samples) ]
Mari kita tinjau data:
# perf report

# ========
# captured on: Sat Aug 20 07:37:05 2016
# hostname : localhost.localdomain
# os release : 3.8.13-98.7.1.el7uek.x86_64
# perf version : 3.8.13-98.7.1.el7uek.x86_64
# arch : x86_64
# nrcpus online : 6
# nrcpus avail : 6
# cpudesc : Intel(R) Core(TM) i7-4790K CPU @ 4.00GHz
# cpuid : GenuineIntel,6,60,3
# total memory : 3785340 kB
# cmdline : /usr/libexec/perf.3.8.13-98.7.1.el7uek.x86_64 record -g fp dd if=/dev/zero of=/test1 bs=1M count=500
# event : name = cpu-clock, type = 1, config = 0x0, config1 = 0x0, config2 = 0x0, excl_usr = 0, excl_kern = 0, excl_host = 0, excl_guest = 1, precise_ip = 0, id = { 39, 40, 41, 42, 43, 44 }
# HEADER_CPU_TOPOLOGY info available, use -I to display
# HEADER_NUMA_TOPOLOGY info available, use -I to display
# pmu mappings: software = 1, tracepoint = 2, breakpoint = 5
# ========
#
# Samples: 503 of event 'cpu-clock'
# Event count (approx.): 503
#
# Overhead Command Shared Object Symbol
# ........ ....... ................. ...........................................
#
16.70% dd [kernel.kallsyms] [k] copy_user_generic_string
|
--- copy_user_generic_string
generic_file_buffered_write_iter
xfs_file_buffered_aio_write
xfs_file_write_iter
do_aio_write
do_sync_write
vfs_write
sys_write
system_call_fastpath
__GI___libc_write

11.33% dd [kernel.kallsyms] [k] __clear_user
|
--- __clear_user
read_zero
vfs_read
sys_read
system_call_fastpath
__GI___libc_read

5.77% dd [kernel.kallsyms] [k] get_page_from_freelist
|
--- get_page_from_freelist
|
|--93.10%-- __alloc_pages_nodemask
| alloc_pages_current
| __page_cache_alloc
| grab_cache_page_write_begin
| xfs_vm_write_begin
| generic_file_buffered_write_iter
| xfs_file_buffered_aio_write
| xfs_file_write_iter
| do_aio_write
| do_sync_write
| vfs_write
| sys_write
| system_call_fastpath
| __GI___libc_write
|
--6.90%-- alloc_pages_current
__page_cache_alloc
grab_cache_page_write_begin
xfs_vm_write_begin
generic_file_buffered_write_iter
xfs_file_buffered_aio_write
xfs_file_write_iter
do_aio_write
do_sync_write
vfs_write
sys_write
system_call_fastpath
__GI___libc_write
Overhead jauh lebih kecil dan kami benar-benar melakukan sys_write standar setelah halaman dialokasikan – memang dalam hal ini permintaan perintah dd kami dimasukkan ke dalam cache terlebih dahulu dan kemudian dikirim ke perangkat back-end yang sebenarnya.
Mari kita jalankan satu lagi opsi perf yang akan memonitor tugas-tugas penjadwal kernel secara dekat pada file pengujian /u01 kita.
# perf record -e sched:sched_switch -e sched:sched_wakeup -e block:* -ag fp dd if=/dev/zero of=/u01/test1 bs=1M count=500
500+0 records in
500+0 records out
524288000 bytes (524 MB) copied, 16.9048 s, 31.0 MB/s
[ perf record: Woken up 3066 times to write data ]
[ perf record: Captured and wrote 767.200 MB perf.data (~33519496 samples) ]
Mari gunakan skrip perf untuk menampilkan data besar:
# perf script
# ========
# captured on: Sat Aug 20 07:50:23 2016
# hostname : localhost.localdomain
# os release : 3.8.13-98.7.1.el7uek.x86_64
# perf version : 3.8.13-98.7.1.el7uek.x86_64
# arch : x86_64
# nrcpus online : 6
# nrcpus avail : 6
# cpudesc : Intel(R) Core(TM) i7-4790K CPU @ 4.00GHz
# cpuid : GenuineIntel,6,60,3
# total memory : 3785340 kB
# cmdline : /usr/libexec/perf.3.8.13-98.7.1.el7uek.x86_64 record -e sched:sched_switch -e sched:sched_wakeup -e block:* -ag fp dd if=/dev/zero of=/u01/test1 bs=1M count=500
# event : name = sched:sched_switch, type = 2, config = 0x11a, config1 = 0x0, config2 = 0x0, excl_usr = 0, excl_kern = 0, excl_host = 0, excl_guest = 1, precise_ip = 0, id = { 45, 46, 47, 48, 49, 50 }
# event : name = sched:sched_wakeup, type = 2, config = 0x11c, config1 = 0x0, config2 = 0x0, excl_usr = 0, excl_kern = 0, excl_host = 0, excl_guest = 1, precise_ip = 0, id = { 51, 52, 53, 54, 55, 56 }
# event : name = block:block_rq_remap, type = 2, config = 0x2be, config1 = 0x0, config2 = 0x0, excl_usr = 0, excl_kern = 0, excl_host = 0, excl_guest = 1, precise_ip = 0, id = { 57, 58, 59, 60, 61, 62 }
# event : name = block:block_bio_remap, type = 2, config = 0x2bf, config1 = 0x0, config2 = 0x0, excl_usr = 0, excl_kern = 0, excl_host = 0, excl_guest = 1, precise_ip = 0, id = { 63, 64, 65, 66, 67, 68 }
# event : name = block:block_split, type = 2, config = 0x2c0, config1 = 0x0, config2 = 0x0, excl_usr = 0, excl_kern = 0, excl_host = 0, excl_guest = 1, precise_ip = 0, id = { 69, 70, 71, 72, 73, 74 }
# event : name = block:block_unplug, type = 2, config = 0x2c1, config1 = 0x0, config2 = 0x0, excl_usr = 0, excl_kern = 0, excl_host = 0, excl_guest = 1, precise_ip = 0, id = { 75, 76, 77, 78, 79, 80 }
# event : name = block:block_plug, type = 2, config = 0x2c2, config1 = 0x0, config2 = 0x0, excl_usr = 0, excl_kern = 0, excl_host = 0, excl_guest = 1, precise_ip = 0, id = { 81, 82, 83, 84, 85, 86 }
# event : name = block:block_sleeprq, type = 2, config = 0x2c3, config1 = 0x0, config2 = 0x0, excl_usr = 0, excl_kern = 0, excl_host = 0, excl_guest = 1, precise_ip = 0, id = { 87, 88, 89, 90, 91, 92 }
# event : name = block:block_getrq, type = 2, config = 0x2c4, config1 = 0x0, config2 = 0x0, excl_usr = 0, excl_kern = 0, excl_host = 0, excl_guest = 1, precise_ip = 0, id = { 93, 94, 95, 96, 97, 98 }
# event : name = block:block_bio_queue, type = 2, config = 0x2c5, config1 = 0x0, config2 = 0x0, excl_usr = 0, excl_kern = 0, excl_host = 0, excl_guest = 1, precise_ip = 0, id = { 99, 100, 101, 102, 103, 104 }
# event : name = block:block_bio_frontmerge, type = 2, config = 0x2c6, config1 = 0x0, config2 = 0x0, excl_usr = 0, excl_kern = 0, excl_host = 0, excl_guest = 1, precise_ip = 0, id = { 105, 106, 107, 108, 109, 110 }
# event : name = block:block_bio_backmerge, type = 2, config = 0x2c7, config1 = 0x0, config2 = 0x0, excl_usr = 0, excl_kern = 0, excl_host = 0, excl_guest = 1, precise_ip = 0, id = { 111, 112, 113, 114, 115, 116 }
# event : name = block:block_bio_complete, type = 2, config = 0x2c8, config1 = 0x0, config2 = 0x0, excl_usr = 0, excl_kern = 0, excl_host = 0, excl_guest = 1, precise_ip = 0, id = { 117, 118, 119, 120, 121, 122 }
# event : name = block:block_bio_bounce, type = 2, config = 0x2c9, config1 = 0x0, config2 = 0x0, excl_usr = 0, excl_kern = 0, excl_host = 0, excl_guest = 1, precise_ip = 0, id = { 123, 124, 125, 126, 127, 128 }
# event : name = block:block_rq_issue, type = 2, config = 0x2ca, config1 = 0x0, config2 = 0x0, excl_usr = 0, excl_kern = 0, excl_host = 0, excl_guest = 1, precise_ip = 0, id = { 129, 130, 131, 132, 133, 134 }
# event : name = block:block_rq_insert, type = 2, config = 0x2cb, config1 = 0x0, config2 = 0x0, excl_usr = 0, excl_kern = 0, excl_host = 0, excl_guest = 1, precise_ip = 0, id = { 135, 136, 137, 138, 139, 140 }
# event : name = block:block_rq_complete, type = 2, config = 0x2cc, config1 = 0x0, config2 = 0x0, excl_usr = 0, excl_kern = 0, excl_host = 0, excl_guest = 1, precise_ip = 0, id = { 141, 142, 143, 144, 145, 146 }
# event : name = block:block_rq_requeue, type = 2, config = 0x2cd, config1 = 0x0, config2 = 0x0, excl_usr = 0, excl_kern = 0, excl_host = 0, excl_guest = 1, precise_ip = 0, id = { 147, 148, 149, 150, 151, 152 }
# event : name = block:block_rq_abort, type = 2, config = 0x2ce, config1 = 0x0, config2 = 0x0, excl_usr = 0, excl_kern = 0, excl_host = 0, excl_guest = 1, precise_ip = 0, id = { 153, 154, 155, 156, 157, 158 }
# HEADER_CPU_TOPOLOGY info available, use -I to display
# HEADER_NUMA_TOPOLOGY info available, use -I to display
# pmu mappings: software = 1, tracepoint = 2, breakpoint = 5
dd 9615 [001] 3378.902792: block:block_bio_queue: 252,2 WS 488 + 8 [dd]
dd 9615 [001] 3378.902798: block:block_bio_remap: 7,1 WS 2536 + 8 <- (252,2) 488
dd 9615 [001] 3378.902810: block:block_bio_queue: 7,1 WS 2536 + 8 [dd]
dd 9615 [001] 3378.902848: sched:sched_switch: prev_comm=dd prev_pid=9615 prev_prio=120 prev_state=D ==> next_comm=swapper/1 next_pid=0 next_prio=120
swapper 0 [000] 3378.902883: sched:sched_wakeup: comm=loop1 pid=2464 prio=100 success=1 target_cpu=000
swapper 0 [000] 3378.902896: sched:sched_switch: prev_comm=swapper/0 prev_pid=0 prev_prio=120 prev_state=R ==> next_comm=loop1 next_pid=2464 next_prio=100
loop1 2464 [000] 3378.902995: block:block_bio_queue: 252,0 WS 5546280 + 8 [loop1]
loop1 2464 [000] 3378.903040: block:block_bio_remap: 8,2 WS 6801704 + 8 <- (252,0) 5546280
loop1 2464 [000] 3378.903064: block:block_bio_remap: 8,0 WS 7827752 + 8 <- (8,2) 6801704
loop1 2464 [000] 3378.903067: block:block_bio_queue: 8,0 WS 7827752 + 8 [loop1]
loop1 2464 [000] 3378.903074: block:block_getrq: 8,0 WS 7827752 + 8 [loop1]
loop1 2464 [000] 3378.903077: block:block_plug: [loop1]
loop1 2464 [000] 3378.903080: block:block_rq_insert: 8,0 WS 0 () 7827752 + 8 [loop1]
loop1 2464 [000] 3378.903083: block:block_unplug: [loop1] 1
loop1 2464 [000] 3378.903086: block:block_rq_issue: 8,0 WS 0 () 7827752 + 8 [loop1]
loop1 2464 [000] 3378.903110: sched:sched_switch: prev_comm=loop1 prev_pid=2464 prev_prio=100 prev_state=S ==> next_comm=swapper/0 next_pid=0 next_prio=120
dd 9615 [000] 3378.903290: block:block_bio_queue: 252,2 WS 488 + 8 [dd]
dd 9615 [000] 3378.903293: block:block_bio_remap: 7,1 WS 2536 + 8 <- (252,2) 488
dd 9615 [000] 3378.903295: block:block_bio_queue: 7,1 WS 2536 + 8 [dd]
dd 9615 [000] 3378.903299: sched:sched_wakeup: comm=loop1 pid=2464 prio=100 success=1 target_cpu=000
dd 9615 [000] 3378.903301: sched:sched_switch: prev_comm=dd prev_pid=9615 prev_prio=120 prev_state=R ==> next_comm=loop1 next_pid=2464 next_prio=100
loop1 2464 [000] 3378.903305: block:block_bio_queue: 252,0 WS 5546280 + 8 [loop1]
loop1 2464 [000] 3378.903308: block:block_bio_remap: 8,2 WS 6801704 + 8 <- (252,0) 5546280
loop1 2464 [000] 3378.903311: block:block_bio_remap: 8,0 WS 7827752 + 8 <- (8,2) 6801704
loop1 2464 [000] 3378.903314: block:block_bio_queue: 8,0 WS 7827752 + 8 [loop1]
loop1 2464 [000] 3378.903318: block:block_getrq: 8,0 WS 7827752 + 8 [loop1]
loop1 2464 [000] 3378.903320: block:block_plug: [loop1]
loop1 2464 [000] 3378.903323: block:block_rq_insert: 8,0 WS 0 () 7827752 + 8 [loop1]
loop1 2464 [000] 3378.903325: block:block_unplug: [loop1] 1
loop1 2464 [000] 3378.903327: block:block_rq_issue: 8,0 WS 0 () 7827752 + 8 [loop1]
loop1 2464 [000] 3378.903340: sched:sched_switch: prev_comm=loop1 prev_pid=2464 prev_prio=100 prev_state=S ==> next_comm=dd next_pid=9615 next_prio=120
dd 9615 [000] 3378.903345: sched:sched_switch: prev_comm=dd prev_pid=9615 prev_prio=120 prev_state=D ==> next_comm=swapper/0 next_pid=0 next_prio=120
We can clearly see that dd and loop1 device is doing WS ( write-sync ) so indeed data is being written in sychronous fashion rather than going into cache first.
Yang tampaknya merupakan bug udev yang memasang sistem file dengan -o sync flag saat boot (bahkan jika /etc/fstab tidak menentukan opsi sinkronisasi):
# mount
/dev/mapper/vgdb-lvu01 on /u01 type ext2 (rw,relatime,sync,seclabel,errors=continue,user_xattr,acl)
/dev/mapper/vgdb-lvu02 on /u02 type ext2 (rw,relatime,async,seclabel,errors=continue,user_xattr,acl)
Memeriksa fstab:
# cat /etc/fstab
/dev/mapper/ol-root / xfs defaults 0 0
/dev/mapper/vgdb-lvu01 /u01 ext2 rw 0 0
/dev/mapper/vgdb-lvu02 /u02 ext2 rw,async 0 0
Contoh penggunaan kinerja – 2
Saat menjalankan dd kecepatan operasi tulis pada node pertama adalah sekitar 350MB/s sedangkan pada Node kedua adalah 3GB/s.
Node pertama:
# dd if=/dev/zero of=/u01/test1 bs=1M count=500
500+0 records in
500+0 records out
524288000 bytes (524 MB) copied, 1.45869 s, 359 MB/s
Node kedua:
# dd if=/dev/zero of=/u01/test1 bs=1M count=500
500+0 records in
500+0 records out
524288000 bytes (524 MB) copied, 0.174886 s, 3.0 GB/s
Mari kita jalankan perf top dan lihat apa yang sebenarnya bisa memperlambat penulisan kita di node1:
PerfTop: 13741 irqs/sec kernel:91.0% exact: 0.0% [4000Hz cpu-clock], (all, 6 CPUs)
---------------------------------------------------------------------------------------------------------------------------------------------------------------------------------------------------------------

20.00% [kernel] [k] clear_page_c
10.97% [kernel] [k] get_page_from_freelist
10.38% [kernel] [k] _raw_spin_unlock_irqrestore
9.17% [kernel] [k] free_hot_cold_page
9.11% Java [.] ZN10JavaCalls
7.67% [kernel] [k] __do_page_fault
5.23% [kernel] [k] __mem_cgroup_commit_charge.constprop.45
5.21% [kernel] [k] __mem_cgroup_try_charge
Dari output kita dapat melihat bahwa kernel sebagian besar membersihkan halaman dan mengalokasikan halaman, pada output kita melihat proses Java juga aktif digunakan. Mari kita lihat Proses Java:
# perf top -s pid,comm
PerfTop: 14134 irqs/sec kernel:91.0% exact: 0.0% [4000Hz cpu-clock], (all, 6 CPUs)
---------------------------------------------------------------------------------------------------------------------------------------------------------------------------------------------------------------
10.86% Java: 9687 Java
10.61% Java: 9685 Java
10.50% Java: 9686 Java
10.34% Java: 9688 Java
10.22% Java: 9694 Java
10.04% Java: 9691 Java
9.70% Java: 9692 Java
9.52% Java: 9690 Java
8.98% Java: 9693 Java
8.85% Java: 9689 Java
Mari kita lihat juga pada level simbol:
# perf top -s pid,comm,symbol,parent
PerfTop: 13865 irqs/sec kernel:90.9% exact: 0.0% [4000Hz cpu-clock], (all, 6 CPUs)
---------------------------------------------------------------------------------------------------------------------------------------------------------------------------------------------------------------

2.49% Java: 9691 Java [k] clear_page_c [other]
2.08% Java: 9687 Java [k] clear_page_c [other]
2.07% Java: 9692 Java [k] clear_page_c [other]
2.01% Java: 9689 Java [k] clear_page_c [other]
1.99% Java: 9688 Java [k] clear_page_c [other]
1.95% Java: 9690 Java [k] clear_page_c [other]
1.94% Java: 9686 Java [k] clear_page_c [other]
1.92% Java: 9685 Java [k] clear_page_c [other]
1.92% Java: 9694 Java [k] clear_page_c [other]
1.61% Java: 9693 Java [k] clear_page_c [other]
1.32% Java: 9691 Java [k] get_page_from_freelist [other]
1.31% Java: 9691 Java [k] _raw_spin_unlock_irqrestore [other]
1.26% Java: 9691 Java [k] free_hot_cold_page [other]
1.15% Java: 9685 Java [k] _raw_spin_unlock_irqrestore [other]
1.14% Java: 9694 Java [k] get_page_from_freelist [other]
1.14% Java: 9694 Java [k] _raw_spin_unlock_irqrestore [other]
1.14% Java: 9692 Java [k] get_page_from_freelist [other]
1.13% Java: 9689 Java [k] _raw_spin_unlock_irqrestore [other]
1.13% Java: 9690 Java [k] get_page_from_freelist [other]
1.11% Java: 9692 Java [k] _raw_spin_unlock_irqrestore [other]
Kita dapat melihat bahwa proses JAVA secara aktif menggunakan wilayah memori. Node kedua benar-benar menganggur karena ini adalah konfigurasi aktif-pasif:
PerfTop: 474 irqs/sec kernel:100.0% exact: 0.0% [4000Hz cpu-clock], (all, 6 CPUs)
---------------------------------------------------------------------------------------------------------------------------------------------------------------------------------------------------------------

22.45% perf.3.8.13-98.7.1.el7uek.x86_64 [.] dso__load_kallsyms
16.33% perf.3.8.13-98.7.1.el7uek.x86_64 [.] symbol_filter
12.24% [kernel] [k] kallsyms_expand_symbol
10.20% [kernel] [k] module_get_kallsym
10.20% [kernel] [k] vsnprintf
Tidak ada yang digunakan pada node2. Tim aplikasi seperti yang diminta untuk menghentikan proses Java yang menyebabkan overhead pada wilayah Memori – menyebabkan kelambatan dalam perintah dd yang menggunakan memori untuk penulisan cache.
Setelah itu kecepatan tulis kembali normal:
# dd if=/dev/zero of=/u01/test1 bs=1M count=500
500+0 records in
500+0 records out
524288000 bytes (524 MB) copied, 0.174886 s, 2.9 GB/s
Contoh lain
1. Pantau semua aktivitas CPU selama 10 detik:
# perf record -g -a sleep 10
Kemudian dapatkan laporan:
# perf report
2. Pantau PID tertentu selama 10 detik:
# perf record -p PID -g -- sleep 10
Kemudian dapatkan laporan:
# perf report
Perf nyala-grafik
Perf mampu membuat grafik api yang lebih mudah untuk diinterpretasikan.
1. Pertama-tama pastikan git terinstal:
# yum install git
2. Kemudian tarik skrip python grafik dari git (ubah pertama ke direktori tempat FlameGraph seharusnya berada):
# git clone https://github.com/brendangregg/FlameGraph
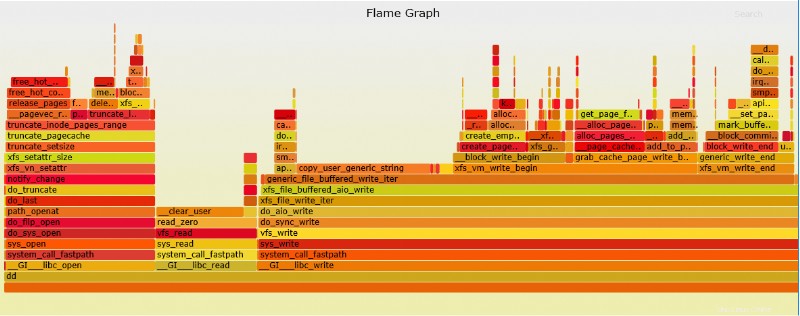
3. Jalankan contoh perf trace:
# perf record -g fp dd if=/dev/zero of=/test1 bs=1M count=500
500+0 records in
500+0 records out
524288000 bytes (524 MB) copied, 0.227305 s, 2.3 GB/s
[ perf record: Woken up 1 times to write data ]
[ perf record: Captured and wrote 0.110 MB perf.data (~4827 samples) ]
4. Ubah keluaran menjadi grafik (SVC):
# perf script | ./stackcollapse-perf.pl > out.perf-folded
# ./flamegraph.pl out.perf-folded > perf-kernel.svg
File SVG sekarang akan ditempatkan di direktori.
Contoh file SVG dari atas dd perf
Pemikiran Akhir
Perf dapat menjadi tambahan yang bagus untuk alat debug OS yang akan membantu dalam masalah pembuatan profil kernel/aplikasi – alat ini mungkin dengan mudah menunjukkan di mana masalahnya atau bagian mana dari fungsi dalam aplikasi/perintah/kernel yang menyebabkan kelambatan. Perf juga dapat dengan mudah mengganti strace karena menyebabkan lebih sedikit overhead dan memiliki opsi yang jauh lebih unggul untuk men-debug panggilan sistem.